How does the Climate Stress Index work?

Climate change is an urgent global issue, with its impacts reverberating across every corner of our planet. From the escalating sea levels to the increasing frequency of extreme weather events, the repercussions of climate change are diverse and far-reaching. To better comprehend and quantify these impacts, we at Lotus Project have we at Lotus Project have devised a metric known as the Climate Stress Index (CSI) a metric known as the Climate Stress Index (CSI). This index offers a comprehensive evaluation of the multiple factors contributing to climate stress in a specific region, providing valuable insights for policymakers, researchers, and environmentalists. When used in tandem with the Rural Development Index (RDMI) – another tool developed by Lotus Project – the CSI gives us a holistic viewpoint of a region's conditions. In this blog post, we will delve into the methodology underpinning the CSI, explaining how it is calculated and how it can be leveraged to inform climate action.
Climate stress is a major issue, encompassing elements such as water availability, air quality, land use, human factors, and geological hazards. Each of these elements contributes to the overall climate stress experienced in a region, and their impact can vary significantly from one location to another.
To encapsulate this complexity, the CSI integrates a broad spectrum of high-resolution, open-source GIS data, typically in the form of GeoTiff. This data is used to derive a suitability score ranging from 0 to 1 for each 30-arcsecond pixel (approximately 1km at the equator) within a country. A higher score on the CSI indicates a higher level of climate stress in the given region. The datasets, each representing a different aspect of climate stress, are sourced from reputable scientific institutions. They span various dimensions of climate stress, including water-related factors, land use and agriculture, air quality and atmospheric conditions and human factors. By amalgamating these diverse datasets, the CSI offers a comprehensive perspective on climate stress, enabling us to compare and contrast climate stress levels across different regions.
Methodology
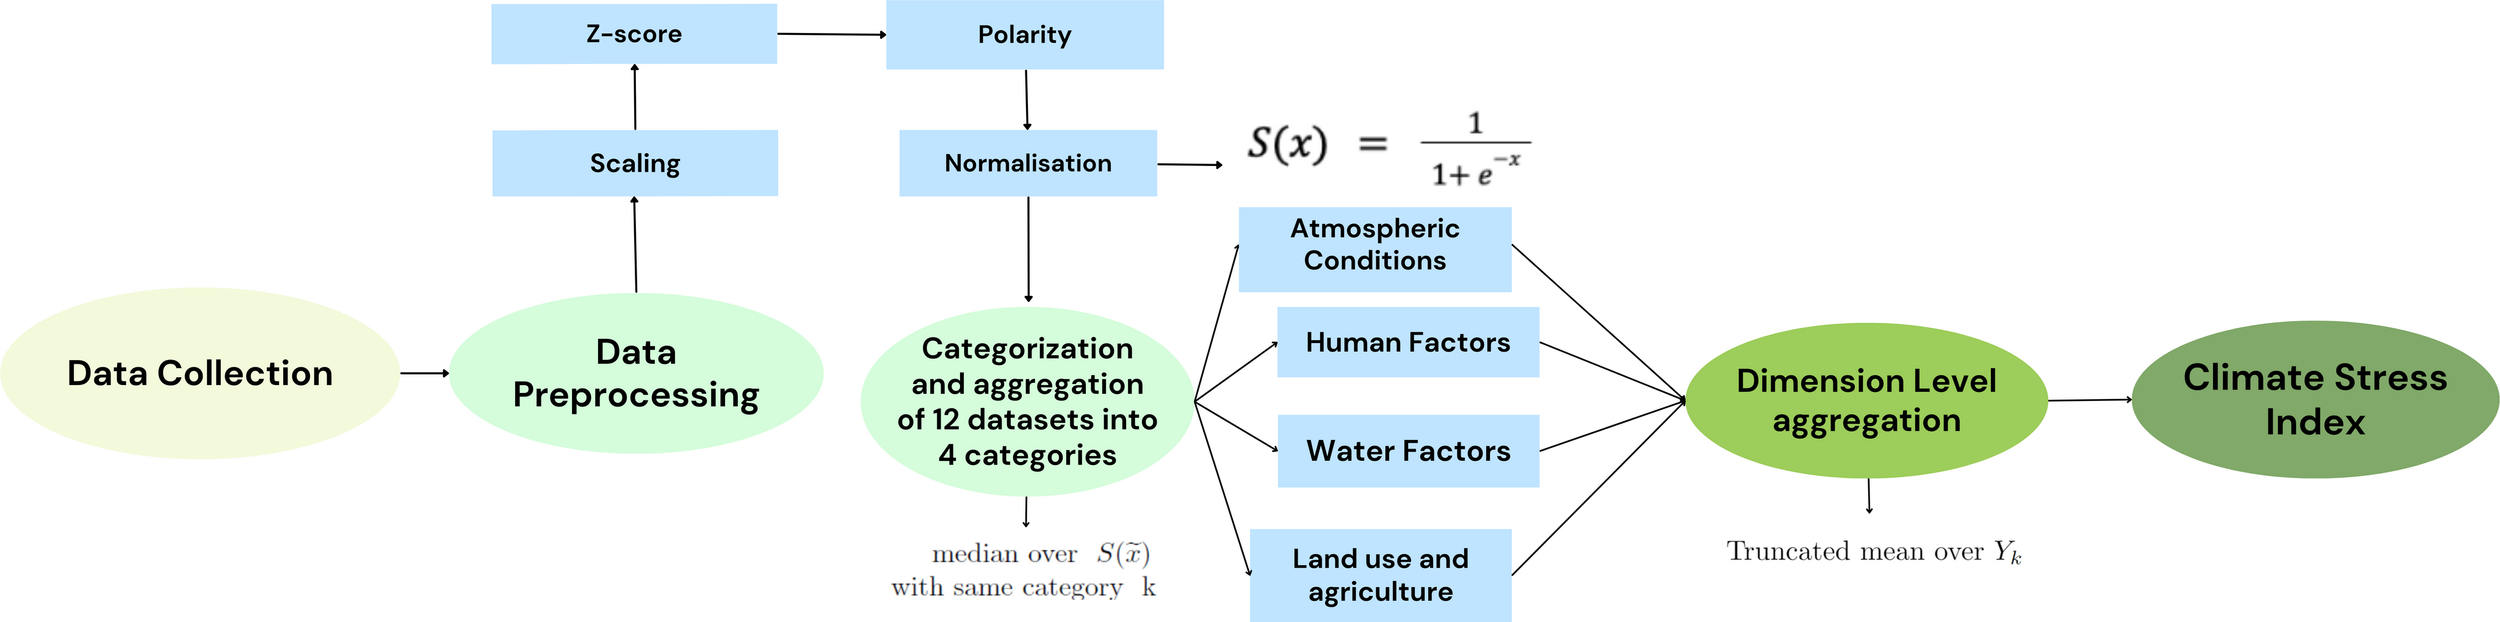
The development of the CSI can be divided into 3 main steps that are data collection, data preprocessing, and categorization & aggregation at both sub-dimension level & dimension levels.
Step 1:
To begin our approach, we conduct an in-depth exploration of various factors that significantly influence climate stress globally. Once we've identified these key factors, we proceed to collect specialized high-resolution open-source GIS data that corresponds to each one. This data is sourced from esteemed institutions such as NASA, WRI, Global Forest Watch, and others, ensuring that our analysis is both comprehensive and grounded in reliable information.
Step 2:
After data collection, we employ a proprietary scaling function derived from the RDMI, utilizing both logarithmic and bisymmetric log transformations. This mathematical approach efficiently rectifies data skewness, yielding a more linear distribution.
Subsequently, we standardize the data via z-score normalization, ensuring a mean of 0 and a standard deviation of 1, thus harmonizing metric scales.
We then adjust metric polarity to align with the CSI's objectives. For instance, metrics like Water stress and PM2.5 Levels directly influence the CSI, whereas metrics like soil thickness inversely affect it. Notably, this isn't always a monotonic relationship. For example, expansive cropland might suggest both enhanced carbon sequestration (negative polarity) and intensified agriculture leading to environmental degradation (positive polarity). Polarity adjustments involve multiplying inversely related metrics by -1.
Lastly, to prevent unbounded metric values post-transformation, we apply a sigmoid function, constraining values within the (0,1) interval.
Step 3:
Having meticulously prepared our data, ensuring all metrics are normalized and bounded within the same range, we now move forward to the next crucial steps in our analysis. Our diverse metrics, each representing a unique facet of climate stress, are categorized into 4 distinct categories. These categories are carefully chosen to encapsulate the broad spectrum of climate stress factors, providing a comprehensive view of the climate stress conditions.
The categories are as follows:
Water-related Factors
Land Use and Agriculture
Air Quality and Atmospheric Conditions
Human Factors
Each category is a collection of related metrics, and we need to aggregate these metrics to obtain a single representative value for each category. This process, known as sub-dimension level aggregation, is performed using the statistical measure of the median. The median, being resistant to outliers, provides a robust measure of central tendency, ensuring that our category representation is not skewed by extreme values.
Upon completion of sub-dimension level aggregation, we are left with a single representative value for each of the 4 categories for every specific region. However, our ultimate goal is to obtain a single value representing the overall climate stress of each region. To achieve this, we conduct aggregation at the dimension level.
Dimension level aggregation involves aggregating the 4 values obtained from the previous step. For this, we employ the truncated mean method. The trimmed mean, which is a compromise between the mean and the median, provides a balance between sensitivity to data and resistance to outliers. By excluding a certain percentage of the extreme values before calculating the mean, the truncated mean offers a more robust and reliable measure for our purpose.
In conclusion, our methodology, starting from data preparation to sub-dimension and dimension level aggregation, is designed to provide a holistic, comprehensive, and robust measure of climate stress. The Climate Stress Index therefore serves as a reliable tool for policymakers, researchers, and environmentalists to understand, quantify, and address the multifaceted challenges posed by climate change.
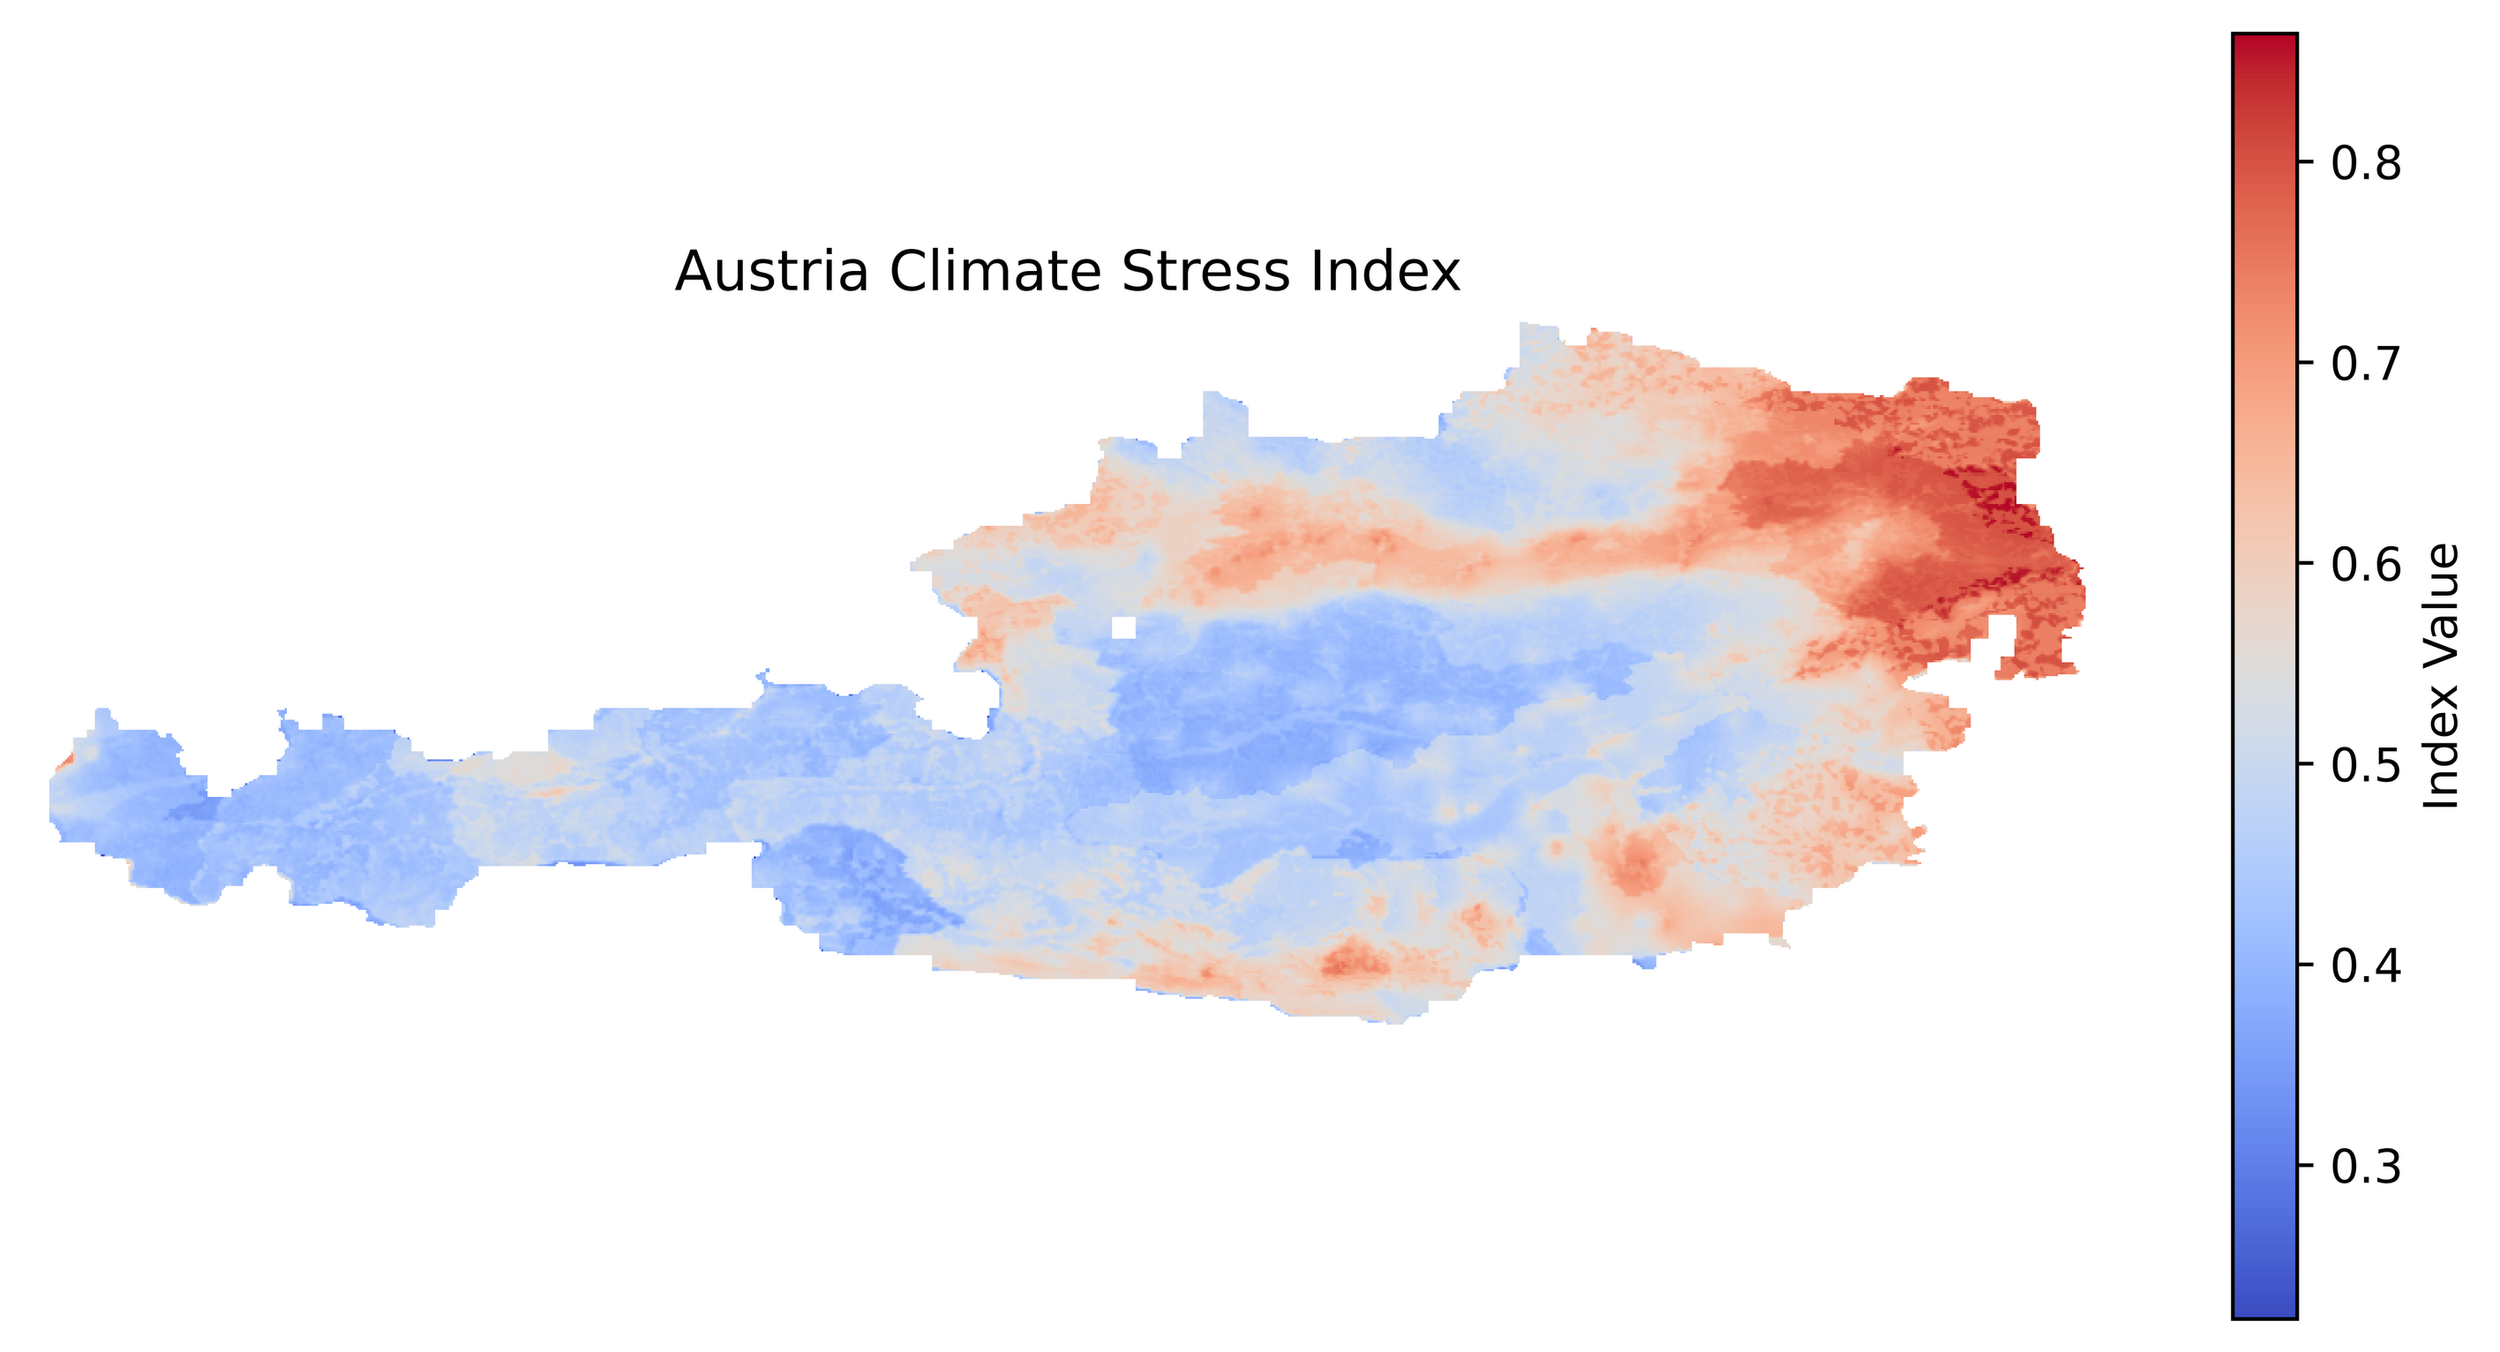
Australian Climate Stress Index
Application and Implication
The CSI stands out in the realm of climate-related metrics, particularly when compared to similar indices such as the INFORM Climate Change Risk index. While many of these indices offer broad, country-level insights by providing a singular value for each nation, the CSI delves deeper. It offers a nuanced understanding of climate stress by presenting data at a 1km resolution, capturing the intricacies and variations within regions that broader metrics might overlook and allowing organizations to target small regions and create real-time impact.
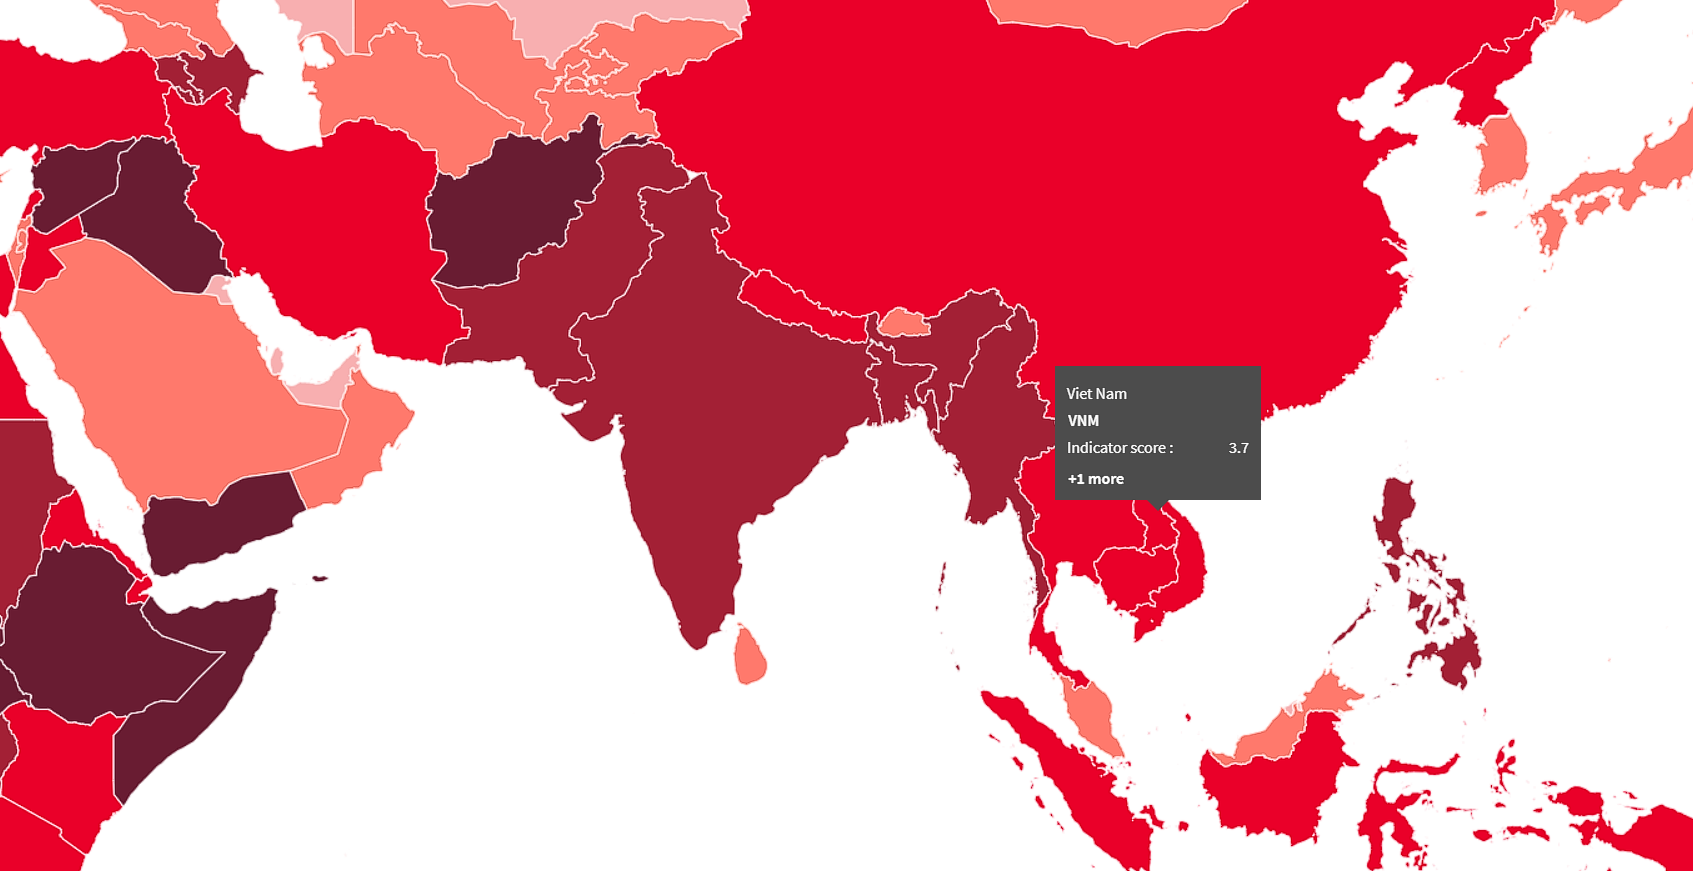
Inform Climate Change Risk Index
The Climate Stress Index (CSI) is a key tool in understanding climate change. By amalgamating multiple variables from diverse fields, the CSI offers a holistic outlook on climate stress, painting a comprehensive picture of global vulnerabilities. This depth of insight empowers policymakers to pinpoint and prioritize regions in dire need of intervention. Additionally, researchers benefit from a robust framework, enabling detailed studies on climate impacts.

Climate Stress Index Vietnam
Future Development
Our framework is designed to be dynamic, and capable of incorporating new metrics as they emerge. Here's a brief overview of how we integrate new data:
Relevance Check: We first ensure the new metric adds value to our existing climate stress profile.
Data Sampling: We then obtain a sample from the source to assess its quality and fit.
Preliminary Integration: The new metric is put through our process of scaling, standardizing, and normalizing.
Impact Assessment: Finally, we evaluate the effect of the new metric on our results. If it enhances our understanding of climate stress, we integrate it fully into our framework.
This approach ensures our framework remains flexible and up-to-date, evolving alongside our growing understanding of climate stress.
The Climate Stress Index (CSI) is not just a static tool; it's a dynamic framework designed to adapt and evolve in response to the ever-changing landscape of climate science and data availability. As we continue to refine and expand the CSI, several key areas of development stand out:
(1) Temporal Analysis
Introducing a time component to track changes year-over-year can help in identifying trends and predicting future stress points.
(2) Socio-economic Data Integration
Climate stress is a multifaceted issue, and its roots often intertwine with socio-economic factors. By incorporating relevant socio-economic data, we can offer a more comprehensive view of a region's vulnerability and resilience to climate stress, ensuring that our analysis is both holistic and grounded.
(3) Expanding the Metric Horizon
Urbanization Rate: The growth of urban areas introduces unique challenges. Urban regions, with their "heat islands", can significantly alter local climate patterns. By integrating urbanization rates, we can pinpoint areas potentially facing heightened stress due to rapid urban expansion.
Biodiversity Metrics: Biodiversity is a bellwether for ecosystem health. A decline in biodiversity often signals ecosystem stress, which can have cascading effects on local climates. By incorporating metrics related to species decline or habitat loss, we can provide a more nuanced understanding of the ecological facets of climate stress.
In essence, the future of the CSI is one of continuous evolution, driven by data, technology, and a commitment to providing the most comprehensive insights into climate stress.
Rehan Ibrahim