What is the RDM Index?
There has been a definite reduction in global poverty over the last few decades, especially in the developing world. However, a central issue that has arisen is it's uneven spread. In particular, rural communities in these countries are most often left behind. See this article by the UN.
At Lotus Project, one of our key aims is to help mitigate this through the Rural Development Model (RDM), which tries to help these rural communities achieve long term sustainable growth in a way which does not harm the environment or social structure. To help facilitate the identification of these communities in a quantitative, data-driven way within a country, we have developed the novel RDM index. It uses open source, high resolution GIS data, usually in the form of GeoTiff to derive a suitability score from 0 to 1 for each 30 arcsecond (about 1km at the equator) pixel of a country. The higher the score the more suitable the locations in that pixel are suitable to apply the RDM.
Approach
There are many different aspects we may want to measure when assessing the suitability of a site to apply the RDM. In order to summarise these into one number, we select appropriate datasets which measure complementary aspects of the RDM, building a composite index to summarise all of them. The approach is unique since building such a composite index with this aim has not been attempted before.
Ideally, each data source should measure something which is important in the RDM. For example, data about suitability of renewable energy resources. We then group the datasets according to what we need them for into three categories:
Environmental e.g. renewable energy suitability
Social e.g. distribution of population
Geographical e.g. plant distribution
After correcting for polarity (so that increases correspond to increases in the RDM index), the aggregation of the data proceeds as follows:
Aggregate the datasets in the same category.
Aggregate the derived category data from the above step across all categories.
Doing the aggregation in this way ensures that each of the categories are weighted equally, but it also gives the option of being able to view single category components of the final index. This gives the user incredible flexibility if they want to concentrate on particular aspects of potential sites such as their environmental development potential. There is also an option to add weights in the future if a user wants to particularly emphasise one category over others.
Datasets
With above in mind, we choose the following datasets:
Source Category Source
Wind environmental Global Wind Atlas
Solar environmental Global Wind Atlas
Population density social WorldPop
NDVI geographical NDVI Nasa
The reason why we choose these datasets is because they are all in GIS (easily processed by rasterio and geopandas packages in python) format, meaning the geographical distribution of the metrics can be extracted easily. This allows us to precisely locate and visually interpret potential sites with a high RDM index. All of the chosen datasets measure a particular aspect of the RDM:
Solar and wind: the suitability to using renewable energy sources.
Population Density: how likely the site is to be part of a rural community.
Normalised Difference Vegetation Index (NDVI), which is a proxy for how much vegetation is present. Can be seen as a way of measuring intensive agriculture.
Framework
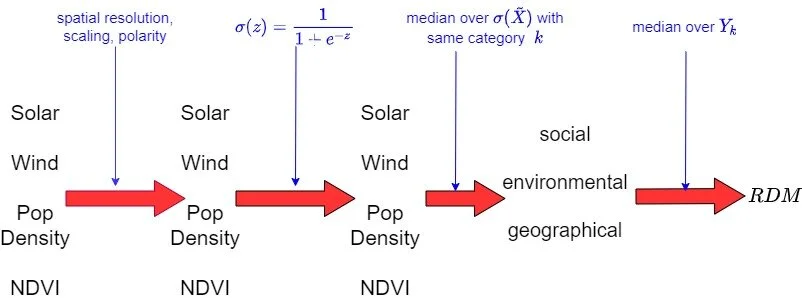
The above framework details how we use the datasets to calculate the final RDM index. It has the following special advantages:
The spatial resolution correction, scaling (based on the inherent scale of the data see this article) and polarity transformation is performed totally automatically with very little human intervention/input, which is highly unique to the RDM index.
Retains interpretability through the second step transforming the data into values between 0 and 1 (closer to 1 the better).
Completely scalable and adaptable to the addition of datasets and categories: simply just add them appropriately and nothing of the above framework is changed.
Example of output

Vietnam

Kenya
On the left, we have the output of the RDM index for Vietnam and on the right Kenya. As we can see the RDM index, besides its unique aims and methods, can give precise spatial distribution across countries. We can produce maps for any other country globally for which there is data available. We provide some interesting observations about the maps above, but the same can be done for other countries.
For Vietnam, we observe the area around Hanoi and Ho Chi Minh city scoring low on the RDM index. This makes sense because these areas are highly urbanised and therefore not good candidates for applying the RDM framework. Meanwhile, in-land areas and the north east of Vietnam score highly. In fact, the two sites in Vietnam chosen prior to the introduction of the RDM index score in the top 12 and 25 percent of RDM values in Vietnam (black and red dots), which provides some external validation that it works as expected. Some more interesting facts can be observed such as the high RDM values in central Vietnam, which have been previously underserved by development funding.
In the case of Kenya, the major cities of Nairobi in the south west and Mombasa in the south east have blue areas i.e. low RDM index values. Again this makes sense because these areas would be unsuitable to apply the RDM framework due to their high population density. However, in the south near Mombasa there are areas with high RDM index.
ANSHUL VERMA